Infographics
A set of Infographics depicting various technical scenarios.

The logical sequence of deliverables of a program with its sub-projects shown as subway map.

The number of invocations of web services by each consumer.

Web service invocations by service grouped by supporting business function.
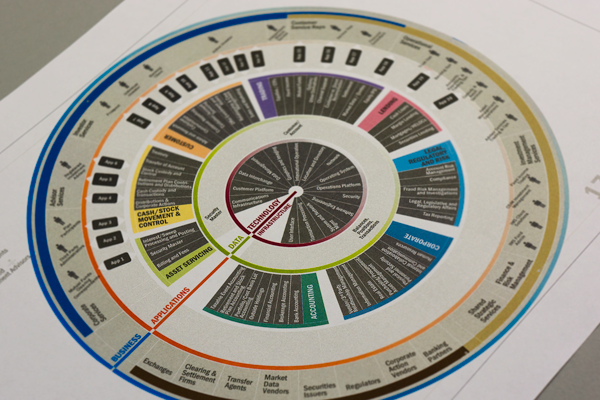
Organization of business functions, supporting applications, and consuming channels and customers.